Assessment Design
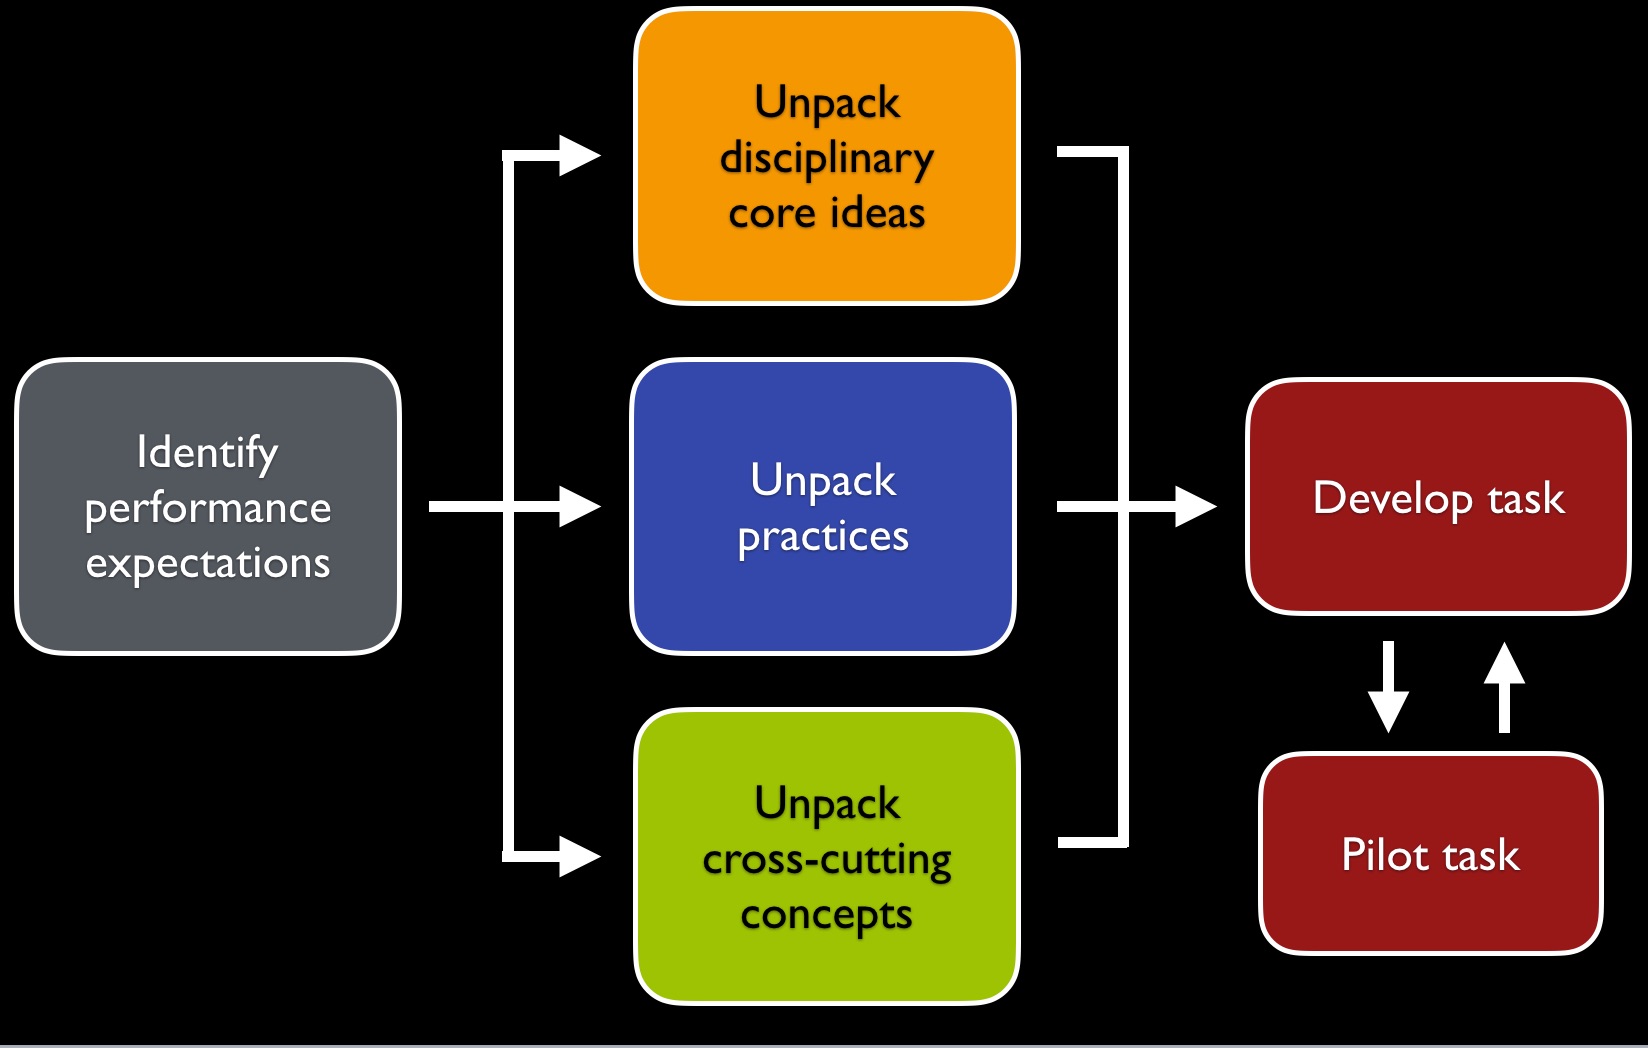
STEP 1: Unpack the Performance Expectation
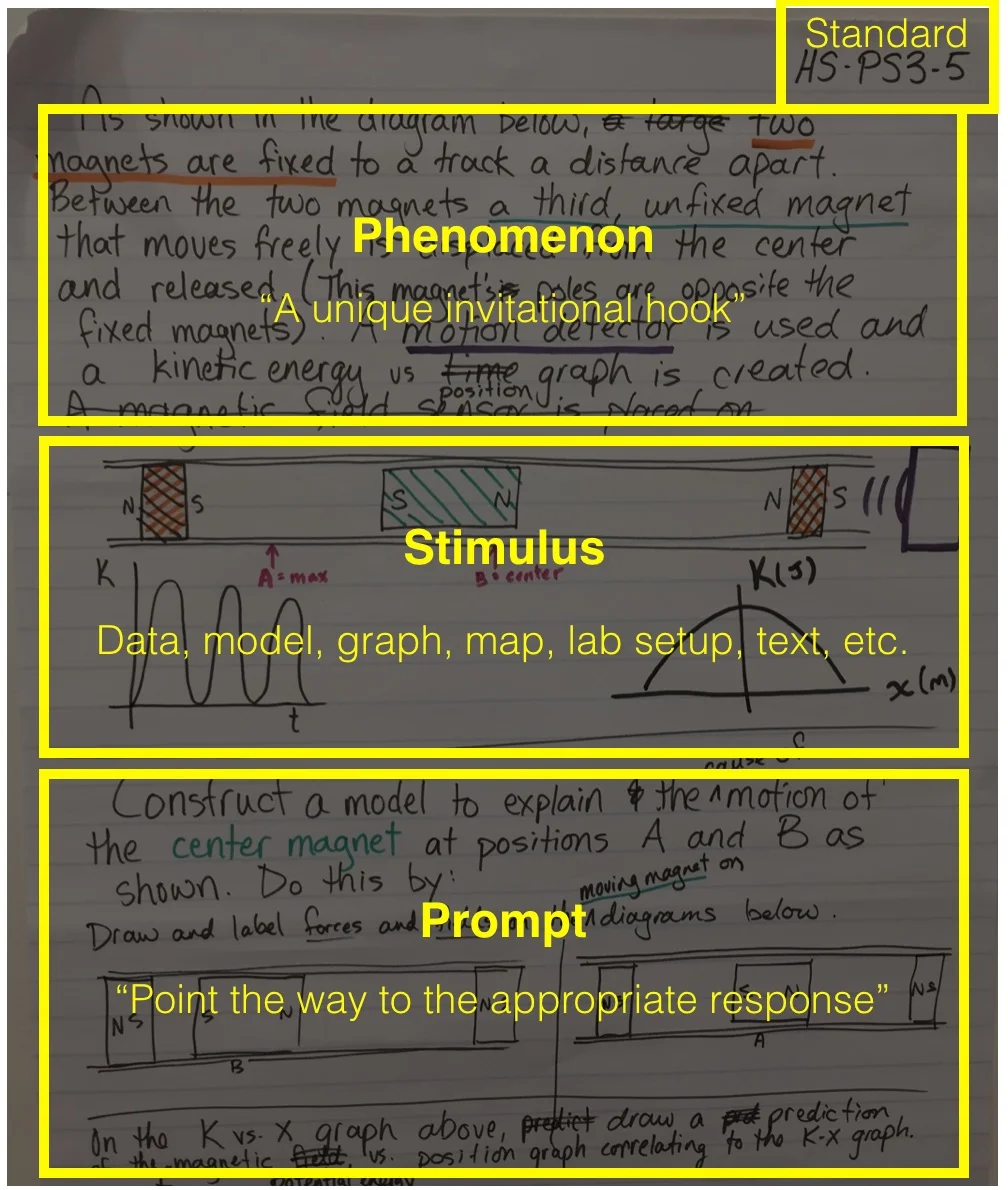
Standard
Unpack the standard to determine the Disciplinary Core Idea, Science and Engineering Practice, and Crosscutting Concept. Individual standards can be found on the Standards Page which can be sorted by Topic View, List View, or State/School View. Once you find the correct standard the 3-Dimensions will be displayed below the evidence statement as seen below. Click on the appropriate dimension for more information and learning progressions.

Develop a task that addresses all three dimensions of the performance expectation. The following design process was developed by the Next Generation Science Assessment initiative. Learn more here.

STEP 2: Develop the Task
PHENOMENON
The phenomenon should welcome students into the question. A good phenomenon will make the assessment approachable by all students. Use a unique phenomenon that addresses the same scientific concepts as other phenomenon used within the course to show transfer of knowledge.
STIMULUS
The stimulus may contain data, models, graphs, maps, lab setups, text, etc. Students will use the stimulus to answer the question. A rich assessment will contain multiple stimuli. All of the information required to answer the prompts must be included in the assessment. Distracting stimuli may be included to discern students knowledge of the standard.
Prompt
Prompts should assess student knowledge while pointing the way to a proper response. Use the following sentence stems to properly assess the correct practices:
Crosscutting Concepts
Sentence Stems and Questions
Patterns
- Write a few sentences below to describe the patterns that you see…
- What patterns do you see in the …
- Describe any patterns you see in the (graph, table, dataset, etc.)…
- Record any patterns you see in the (data, graph, table, model, etc..)…
- What do I notice after careful observation? Do any features emerge that are interesting or need further study?
- What patterns do you notice in this …
- What questions do I have about these patterns…
- What features of these patterns can you explain using…
- What further investigation or observation of the system would help to clarify these patterns and their causes or implications?
Cause and Effect
- Identify possible causes for the (effects)…
- Explain how the ____ caused the ______ to…
- What process caused the…
- Write a claim for the most likely cause or causes of…
- What mechanism may be responsible for the …
- What evidence do you have that this cause-effect relationship is not just a correlation?
- List any additional or alternative causes.
- What relationships might be described as a cause and effect relationship?
Structure and Function
- What structures and properties are important for the …
- What particular shapes or structures are observed in …
- What roles do these structures have in the …
Systems and System Models
- What system or system do we need to model in order to explain this phenomenon?
- Add each part of the system in a circle and show the interactions…
- What scale within the system do we need to…
- How can we best choose to delineate the boundary of this system?
- What are the components or sub-systems of this system?
Energy and Matter
- What matter flows into, out of, and within this system?
- Describe how matter moves from ___ to ___ in this system.
- Draw one or more arrows to show how matter moves between…
- What physical and chemical changes occur during this phenomenon?
- What energy transfers occur into, out of, or within the system?
- What transformations are important to …
- Which graph best represents the (total, kinetic, potential) energy…
- Draw a model that show how matter was changed..
- Draw a model that shows how energy was..
- Use the graph to estimate the amount of energy..
- What are the needed outputs for this system to function?
- What are the desired outputs of the system?
Scale, Proportion, and Quantity
- What aspects of this system do you need to measure or quantify in order to describe it more precisely?
- On what scale (i.e. with what units and to what precision) do we need to measure it?
- Can I use a scale model to test my design?
- What ratio of model to final system is reasonable to build?
- What relationships between measurable quantities or between controlled conditions and measured quantities do we observe?
Stability and Change
- Under what range of conditions does this system operate effectively.
- What feedback loops are required to keep this system stable?
- How can I improve the stability of …
- What conditions would cause this (phenomenon) to become unstable or fail?
- Describe the processes that could have changed..
Science and Engineering Practices
Sentence Stems and Questions
Asking Questions
- Write one question about how that _____ could answer that would help explain _____. Explain your reasoning.
- Identify one factor that would affect _____. Explain your reasoning.
- Which question could most likely be answered by this investigation? (MC)
- Which hypothesis will most likely help the student _____? (MC)
Defining Problems
Using Models
- Draw a model that represents ____.
- Use ____ model to explain the process of how _____. You may draw a diagram in your explanation.
- Identify what the _____ in _____ model represents.
- Describe what _____ can do with the _____ to provide evidence to support his claim.
- Draw a model that shows what happens when _____ supports his claim.
- Explain how your model supports _____’s claim.
- Create a flow chart to describe how _____.
- Complete the flow chart to show the main steps in _____
- Claim. Which statement best describes what the scientist’s model needs to represent in order to support his claim?
- Draw two models, one representing _____ and one representing _____, to show how _____.
- Use the model to describe _____.
- Which statement best explains ____ of ____’s model?
- Draw a model that explains the result that ____.
- Use these models to explain why _____.
- Draw a model of _____. Explain your model.
- Describe what a model would show that explains why _____.
Conducting Investigations
- Describe a procedure using these supplies that ____ may follow to test his hypothesis.
- Explain the most likely reason _____ uses the same ____ for each test.
- Identify the independent and dependent variables for this investigation.
- Make a claim about the _____ that can be supported by evidence from the investigation and _____. Explain your reasoning.
- Describe one way that ____ could ____. Explain why this would ____.
- Describe how ____ could investigate a solution to this problem. Explain why the investigation is reasonable based on ____.
- Which statement describes a conclusion that would be supported by this investigation?_____Newton’s third law of motion to support your answer.
Analyzing Data
- Identify the data that can be used from this ____ to provide evidence of _____. Explain why these data provide evidence of _____.
- What additional evidence could support the scientist’s theory that _____? Explain why this evidence supports the theory.
Using Mathematics and Computational Thinking
Constructing Explanations
- Describe the evidence in the table that supports the claim that _____. Explain why the evidence supports the claim.
- Describe how the _____ compares to the _____. Explain your reasoning.
- Use evidence from the table to support the claim that _____.
- Make a claim about the effect of _____. Support your claim using evidence from the table.
- Explain why ____. Support your explanation using evidence from the table.
- Make a claim for how ____. Support your claim with evidence from the facts.
- Explain the relationship between _____ and the_____.
- Identify two pieces of evidence to support the claim that _____. Explain why you think each piece of evidence supports the claim.
- Explain how the data in the graph support the idea that _____.
- Use the information in the graph to explain how _____ affects the _____.
- Explain how _____ affect the _____. Support your answer with evidence from the table.
- Make a claim for how_____. Support your claim with evidence from the facts.
- Explain the relationship between _____ and_____.
- How does ____ affect _____. Justify your conclusion using evidence from the diagram.
- Describe _____, using evidence from the diagram.
- Describe how _____, using evidence from the diagram.
Designing Solutions
- Explain how ____ could be increased. Support your explanation using _____.
Arguing from Evidence
- Use evidence from these models to support an argument that _____.
- _____ makes a claim that the _____. He does an investigation to test his claim, following this procedure. 1,2,3,4,etc. Which statement best explains why ____’s claim is supported by the data?
- Student Claim. Use reasoning to either defend or refute the student’s claim. Support your reasoning with evidence from the table.
- Study. Scientist claim. Identify two pieces of evidence from the study that support the claim. Explain your reasoning.
- Which claim does this evidence best support?
- Claim. Which statement best supports this claim?
- A student evaluates these observations and makes this claim: _____ Use reasoning to either defend or refute the student’s claim. Support your reasoning with evidence from the table.
- Identify two pieces of evidence to support the claim that _____ Explain why you think each piece of evidence supports the claim.
- Identify two pieces of evidence from the study that support the claim. Explain your reasoning.
- _____ claims that _____. Use evidence from the diagram to explain whether _____’s claim is supported.
Communicating Information
- Use the information in the articles to explain _____.
- Explain whether or not each article is reliable.
- Evaluate how each article addresses _____. Be sure to comment on any possible bias in each article.
- Which statement best describes the data presented in the graph?