
Quantity Playground
Investigations in Relationships, Patterns and Proportions
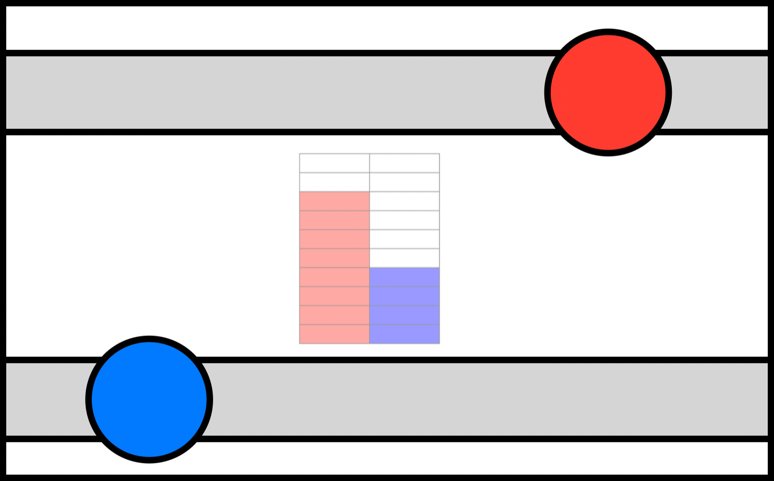
1 - Visualizing Quantity
Quantify data in simple bar graphs. Change the data with interactive sliders.
Investigate variable relationships between quantities in a system.
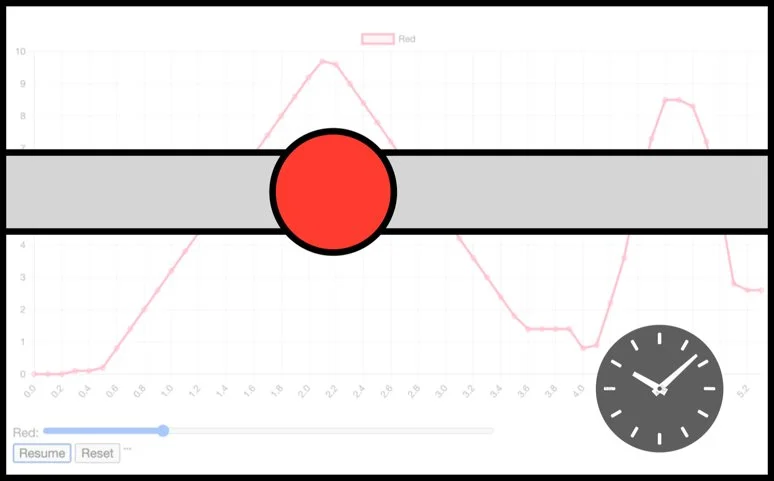
7 - Direct Relationships Over Time
Explore linear relationships between two data sets with this graphing exploration.

10 - Square / Square Root Relationship
Explore square and square root relationships with this interactive.

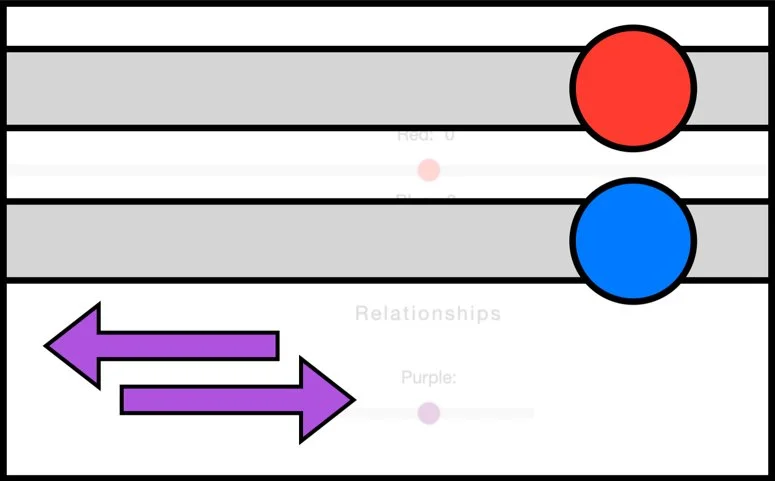
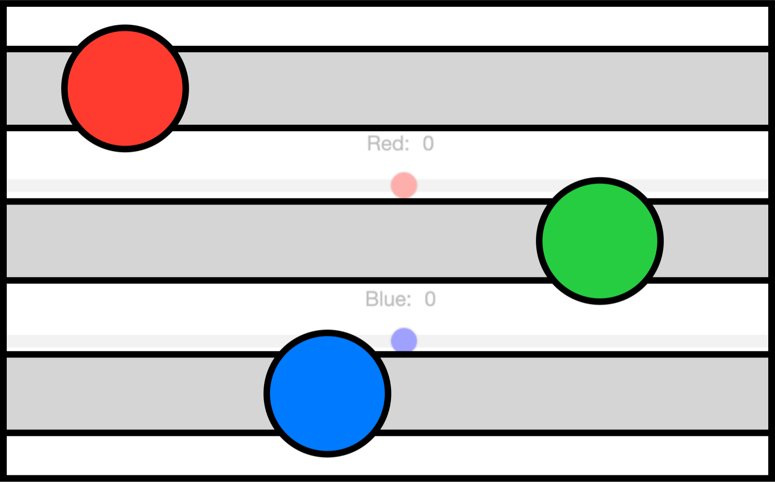
2 - Relationships in Quantity
Investigate a simple relationship between two sets of data.
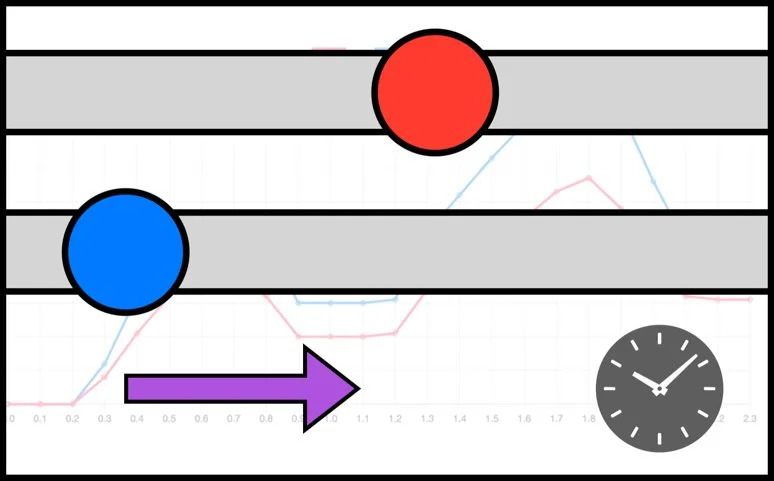
5 - Quantity Over Time
Explore graphing data over time with this simple interactive web app.

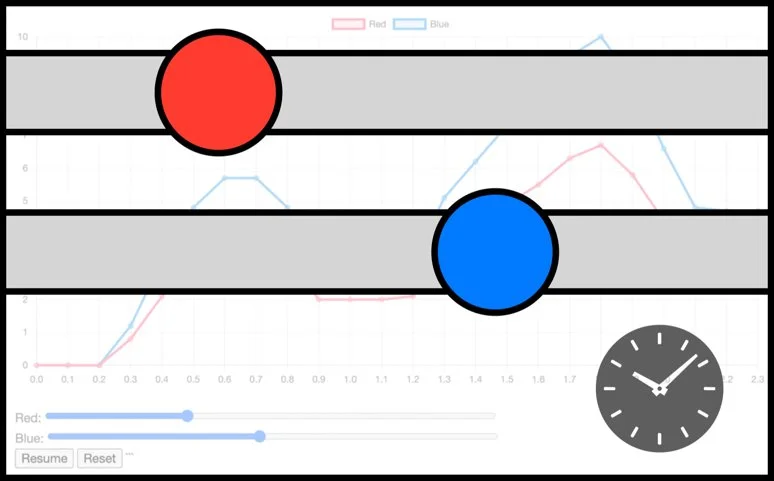
8 - Indirect Relationships Over Time
Explore linear relationships between two data sets with this graphing exploration.
Investigate relationships between three quantities in a mathematical system
6 - Independent Relationship Over Time
Explore graphs of two sets of data over that show independent relationships.
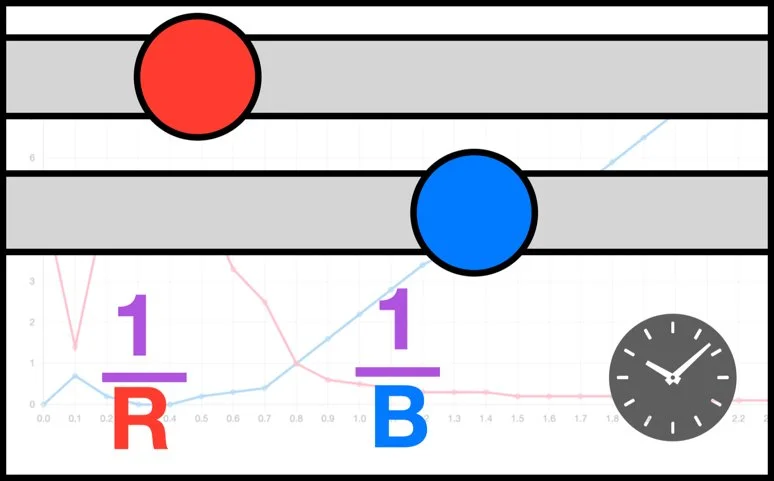
9 - Inverse Relationships
Explore inverse relationships with this interactive.
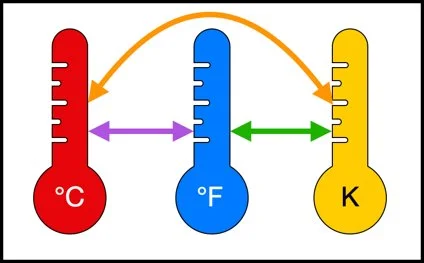
11 - Temperature Convertor
Use sliders to investigate relationships in various temperature scales.