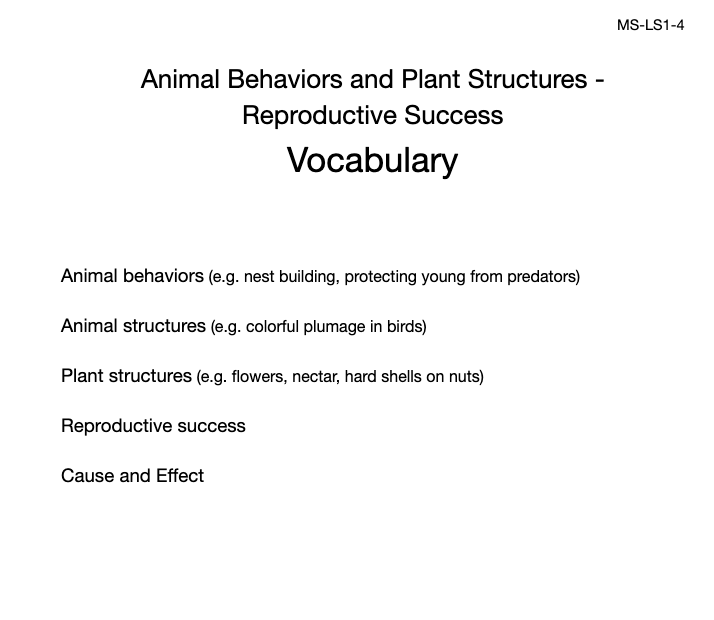
MS-LS1-4: Animal Behaviors and Plant Structures - Reproductive Success
Use argument based on empirical evidence and scientific reasoning to support an explanation for how characteristic animal behaviors and specialized plant structures affect the probability of successful reproduction of animals and plants respectively. (Cause and Effect)
Clarification Statement: Examples of behaviors that affect the probability of animal reproduction could include nest building to protect young from cold, herding of animals to protect young from predators, and vocalization of animals and colorful plumage to attract mates for breeding. Examples of animal behaviors that affect the probability of plant reproduction could include transferring pollen or seeds, and creating conditions for seed germination and growth. Examples of plant structures could include bright flowers attracting butterflies that transfer pollen, flower nectar and odors that attract insects that transfer pollen, and hard shells on nuts that squirrels bury.
Assessment Boundary: none
Science Practices
Engaging in Argument from Evidence
Disciplinary Core Ideas
LS1.B: Growth and Development of Organisms
Crosscutting Concepts
Cause and Effect
Assessments
The Wonder of Science Assessments
Shared Assessments
The following assessments were shared by teachers implementing the NGSS. Many of these are drafts and should be used accordingly. Feel free to improve these assessments or contribute your own. Learn more here.
Instructional Resources
Mini Lessons
The Wonder of Science Resources
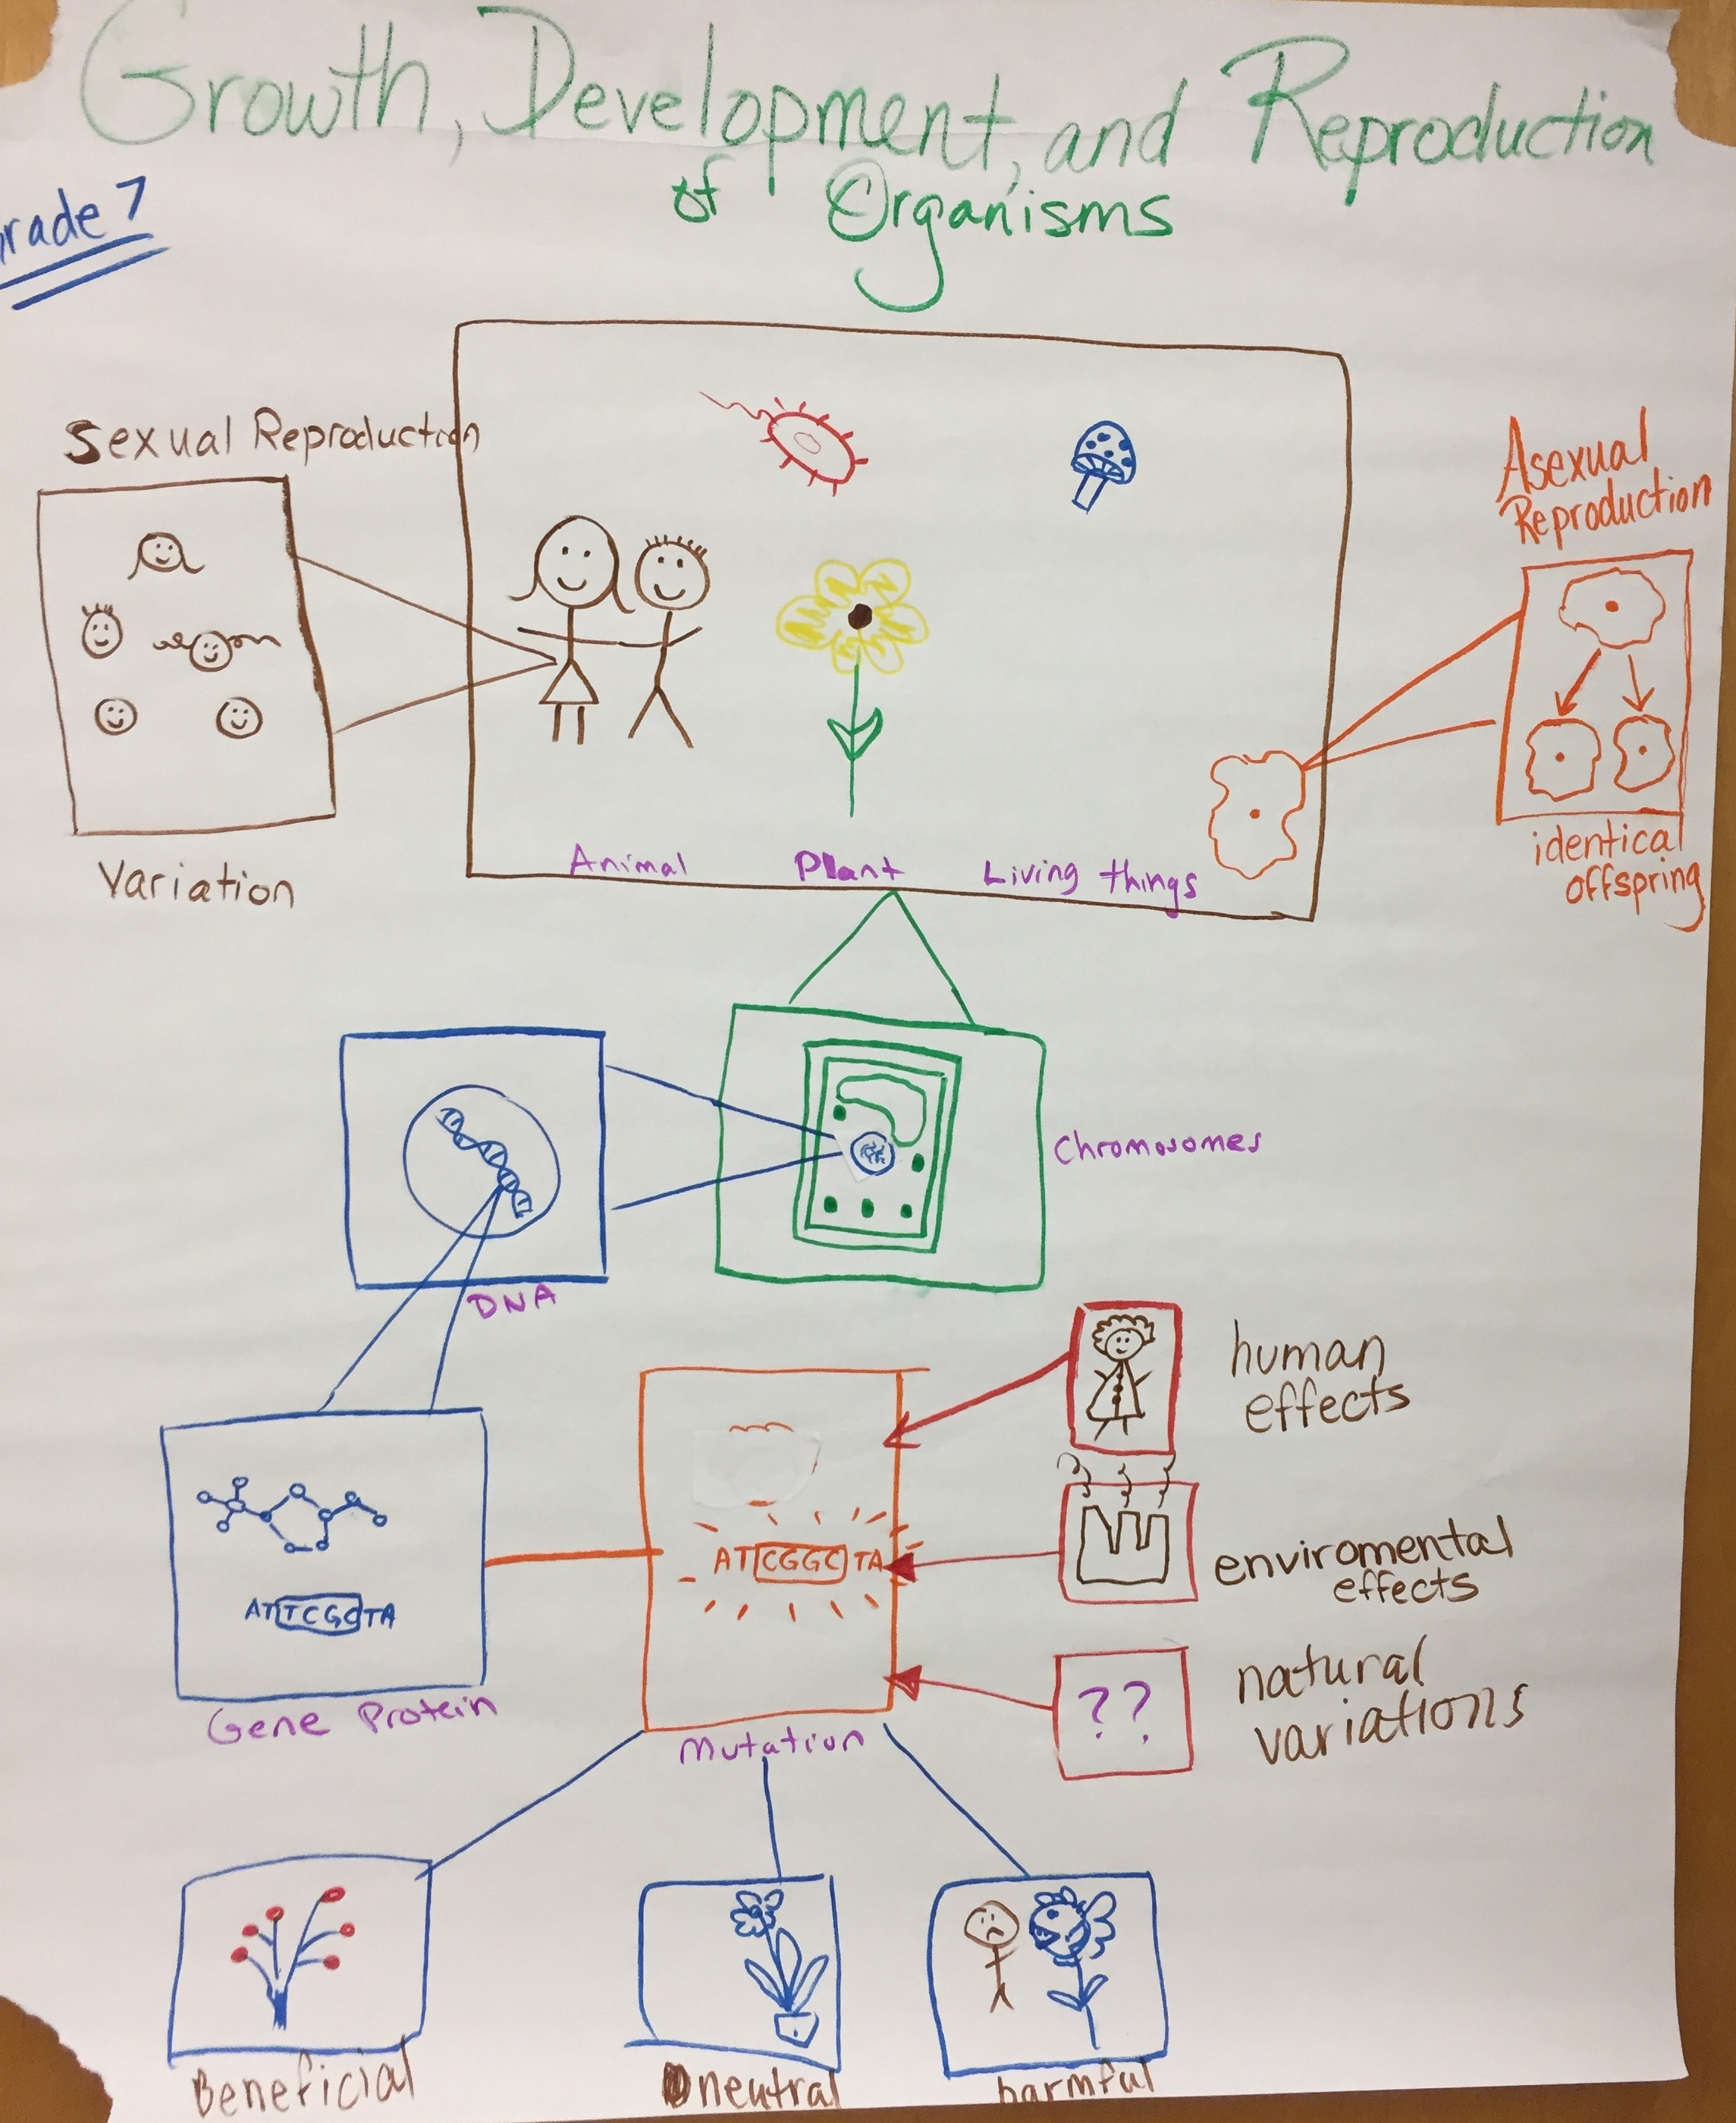
Anchor Charts
Phenomena
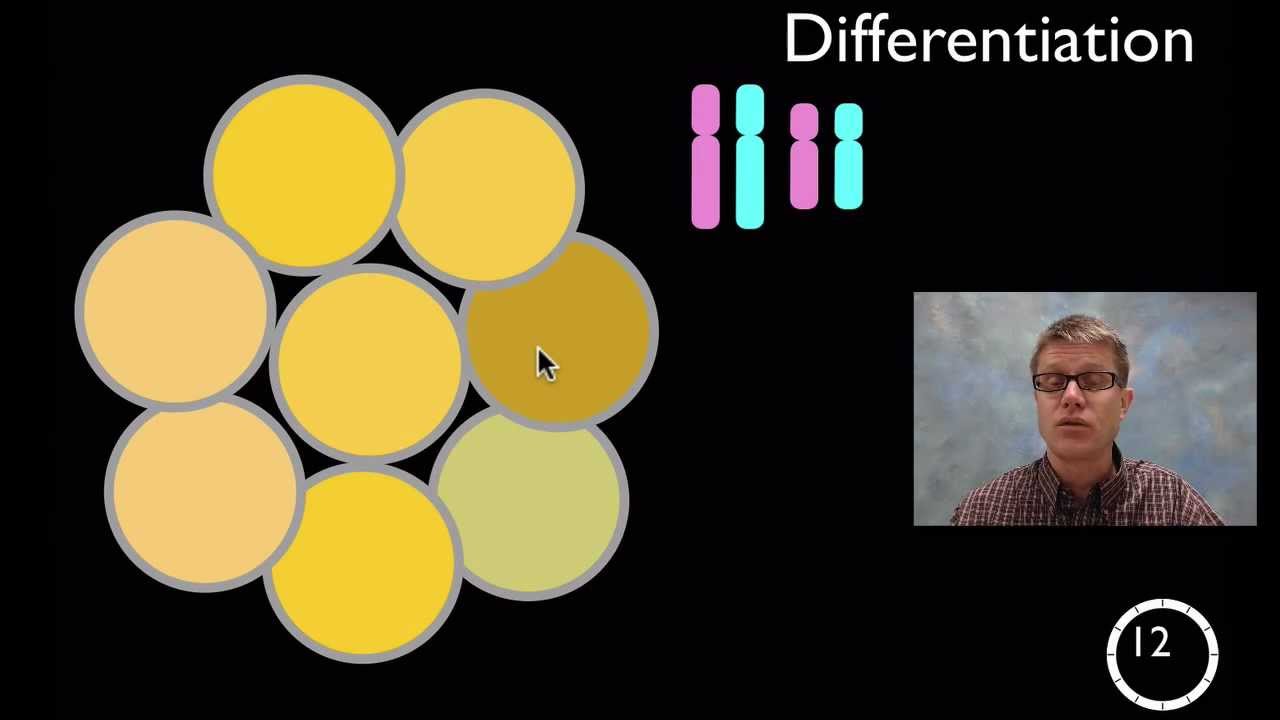
Videos
Learning Plans
Storylines
Common Core Connections
ELA/Literacy
RI.6.8 - Trace and evaluate the argument and specific claims in a text, distinguishing claims that are supported by reasons and evidence from claims that are not.
RST.6-8.1 - Cite specific textual evidence to support analysis of science and technical texts.
WHST.6-8.1 - Cite specific textual evidence to support analysis of science and technical texts.
Mathematics
6.SP.A.2 - Understand that a set of data collected to answer a statistical question has a distribution which can be described by its center, spread, and overall shape.
6.SP.B.4 - Display numerical data in plots on a number line, including dot plots, histograms, and box plots.
*Next Generation Science Standards is a registered trademark of Achieve. Neither Achieve nor the lead states and partners that developed the Next Generation Science Standards were involved in the production of this product, and do not endorse it. Visit the official NGSS website.


