
PS1.A: Structure and Properties of Matter

In the first physical science video for the Next Generation Science Standards Paul Andersen explains the structure and properties of matter. He starts by explaining how all matter is made of about 100 smaller particles called matter. He explains a teaching progression for introducing the topic of matter K-12. This begins with a brief introduction to substances that can be scientifically observed at many levels. This eventually builds through molecules and pure substances to the subatomic structure of atoms and the importance of binding energy.
CCC1: Patterns

Paul Andersen explains patterns and describes why pattern recognition is an important skill in science and engineering. He begins by discussing patterns in nature, including snowflakes, flower petals, seasons and nucleotides in DNA. He then illustrates the importance of classification in describing and eventually understanding patterns. He gives a progression instruction in the science classroom from grade K to 12. A secret pattern is hidden within the video.
SEP4: Analyzing and Interpreting Data
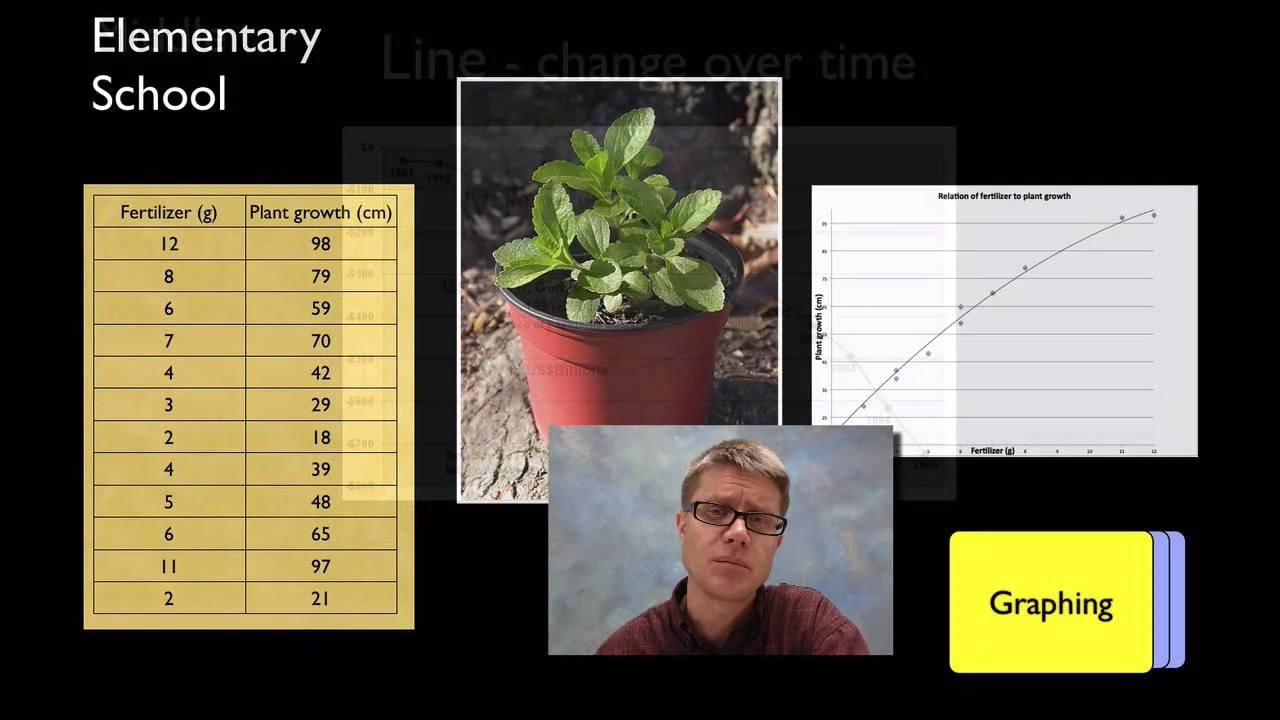
Paul Andersen explains how scientists analyze and interpret data. Data can be organized in a table and displayed using a graph. Students should learn how to present and evaluate data.