
Paul Andersen explains how scientists analyze and interpret data. Data can be organized in a table and displayed using a graph. Students should learn how to present and evaluate data.
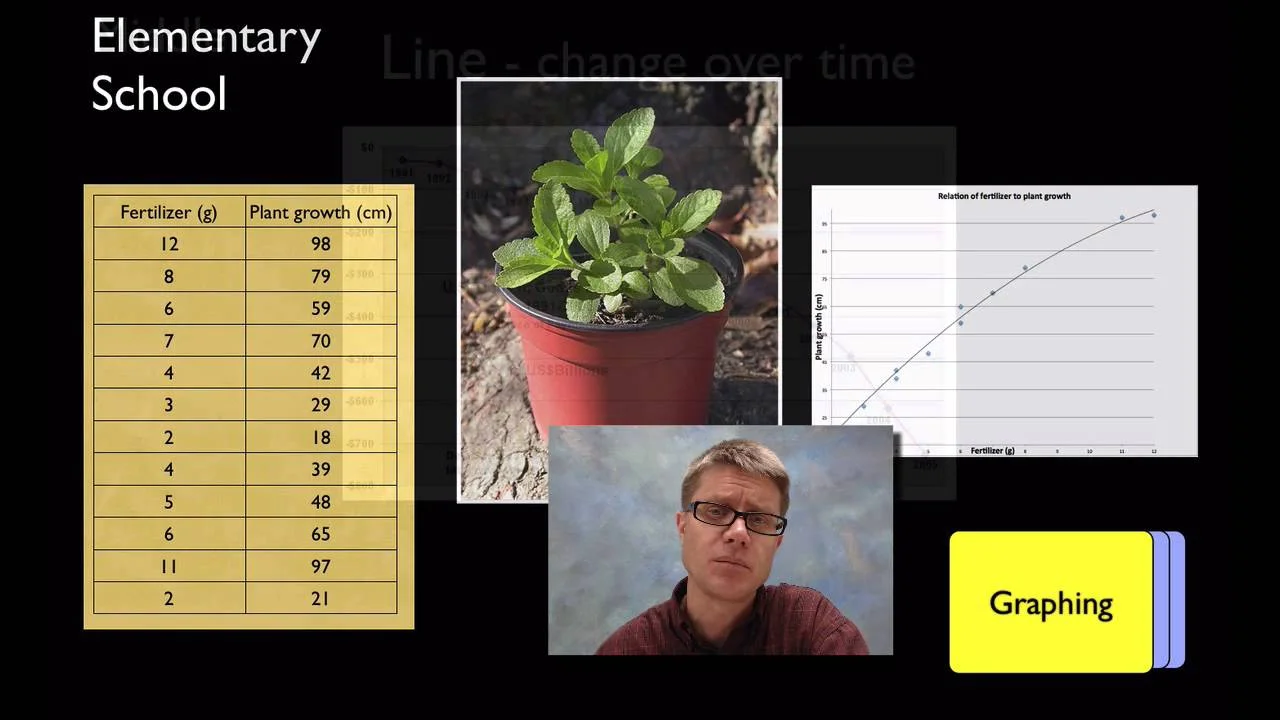
Paul Andersen explains how scientists analyze and interpret data. Data can be organized in a table and displayed using a graph. Students should learn how to present and evaluate data.
